As a real estate agent, you’ll need eye-catching graphics to attract new clients to your business. Using infographics, you can express a lot of information with attractive and informative visuals. However, you might be wondering how to make real estate infographics from scratch.
Fortunately, Jigglar makes it super easy to create real estate infographics. You can choose from one of our templates and customize it to fit your branding. Then, it’s simply a matter of sharing it online!
In today’s post, we’ll explain why your agency should consider using real estate infographics. Then, we’ll show you how to make one in three easy steps. Let’s get started!
Why You Should Consider Using Real Estate Infographics
Infographics are images that convey data or other information in a visual format. As a real estate agency, you might use an infographic to teach clients about the neighborhoods where you sell houses, your agency’s sales statistics, or a checklist for selling a home with you:

Using infographics can be highly beneficial for your agency. The visual format makes it easy to convey complex information without boring or overwhelming your clients. After all, the human brain can process visual information in just 13 milliseconds!
Furthermore, since infographics are so eye-catching and digestible, you can use them in your real estate marketing materials. For instance, you might utilize them on your social media accounts, publish them on your agency website, or even print them out and distribute them as physical flyers in your target neighborhoods.
How to Create Real Estate Infographics (In 3 Easy Steps)
In this tutorial, we’ll be showing you how to create real estate infographics with Jigglar. Our real estate design tool provides hundreds of customizable templates, along with a 30-day free trial to explore the interface. Let’s jump into making an infographic!
Step 1: Sign Up for Jigglar and Choose an Infographic Template
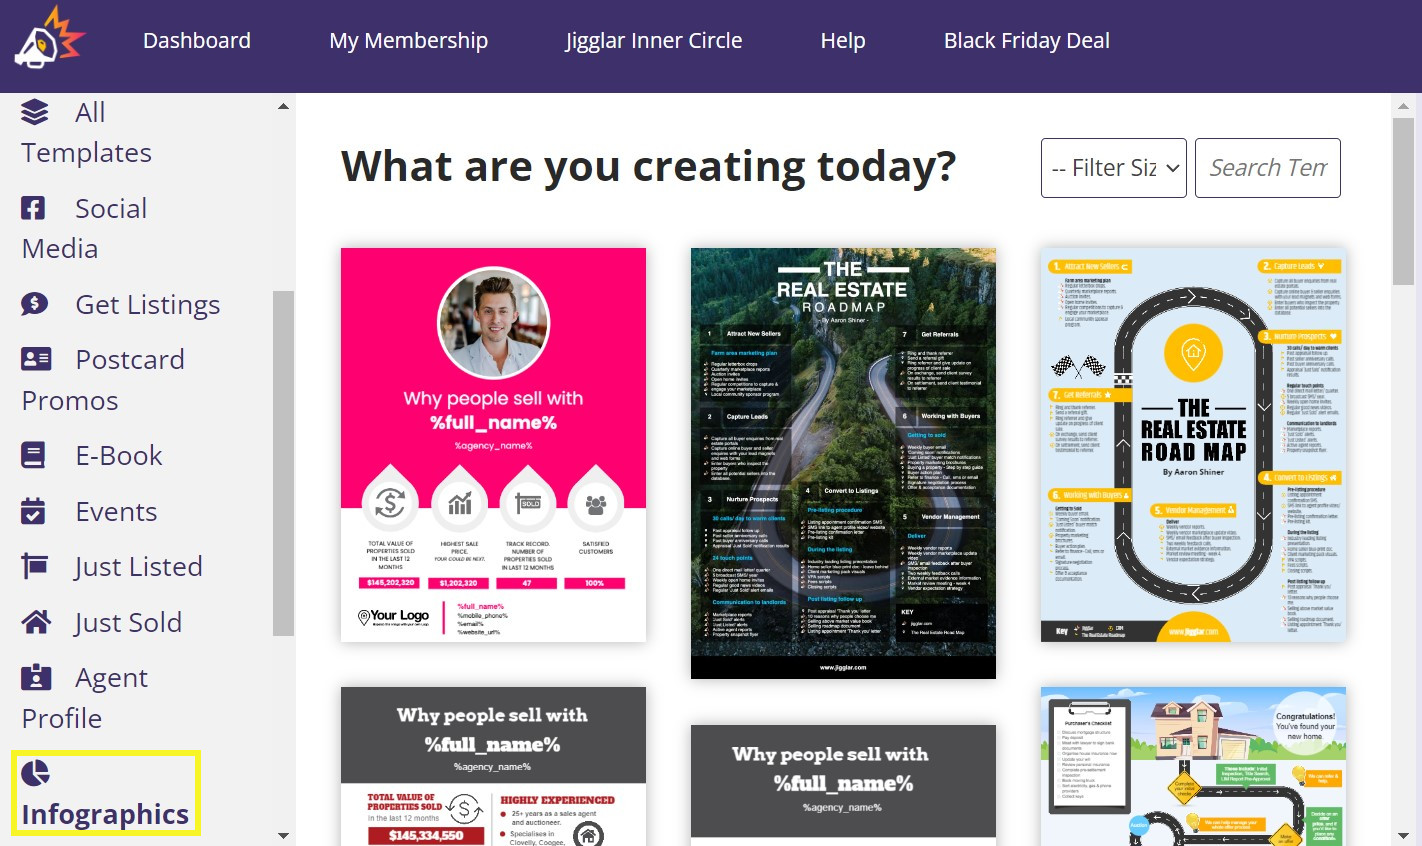
Firstly, you’ll need to sign up for a Jigglar account. During the sign-up process, you’ll be prompted to enter your agency’s name, details, your name, and a photo. Then, this information will automatically be applied to any real estate templates from the Jigglar library.
Once you’re in the Jigglar dashboard, select Infographics under the Template Categories header in the left-hand menu. You should now see a selection of infographic templates:
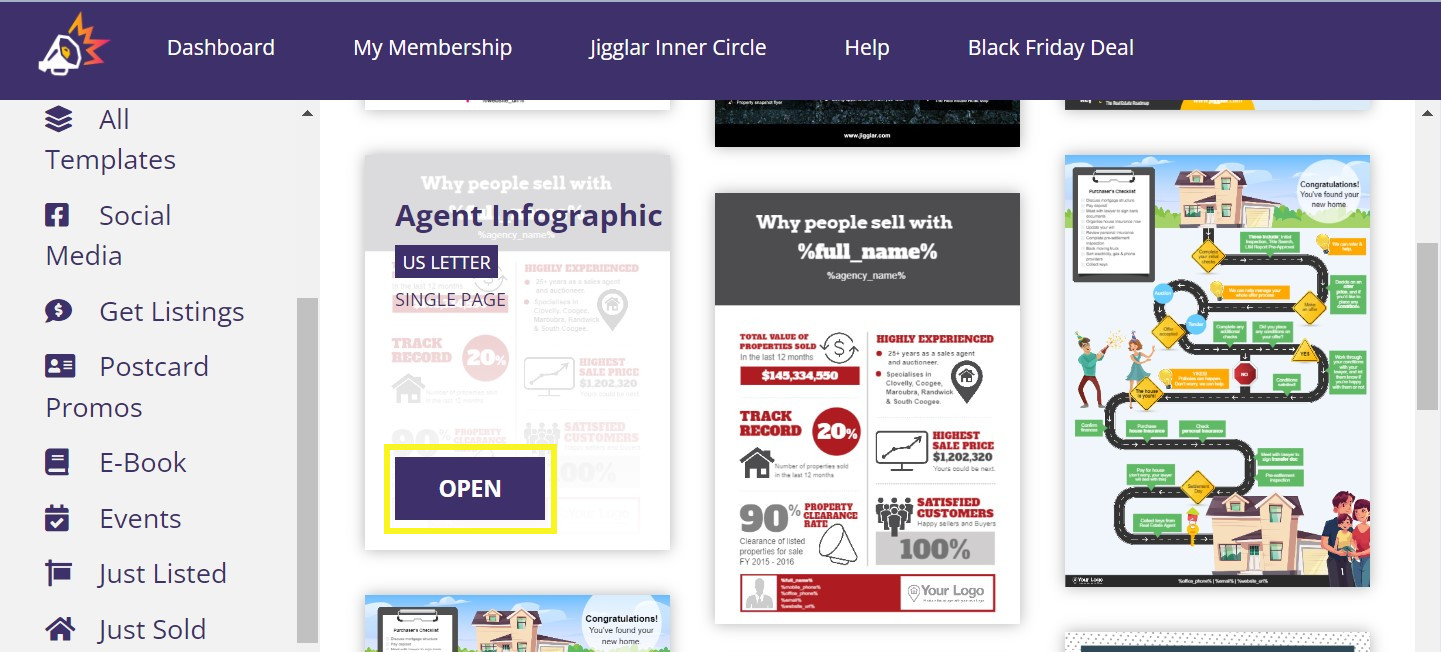
Simply hover over your chosen template and click on OPEN:
You’ll now be taken to the Jigglar editing interface.
Step 2: Customize Your Infographic
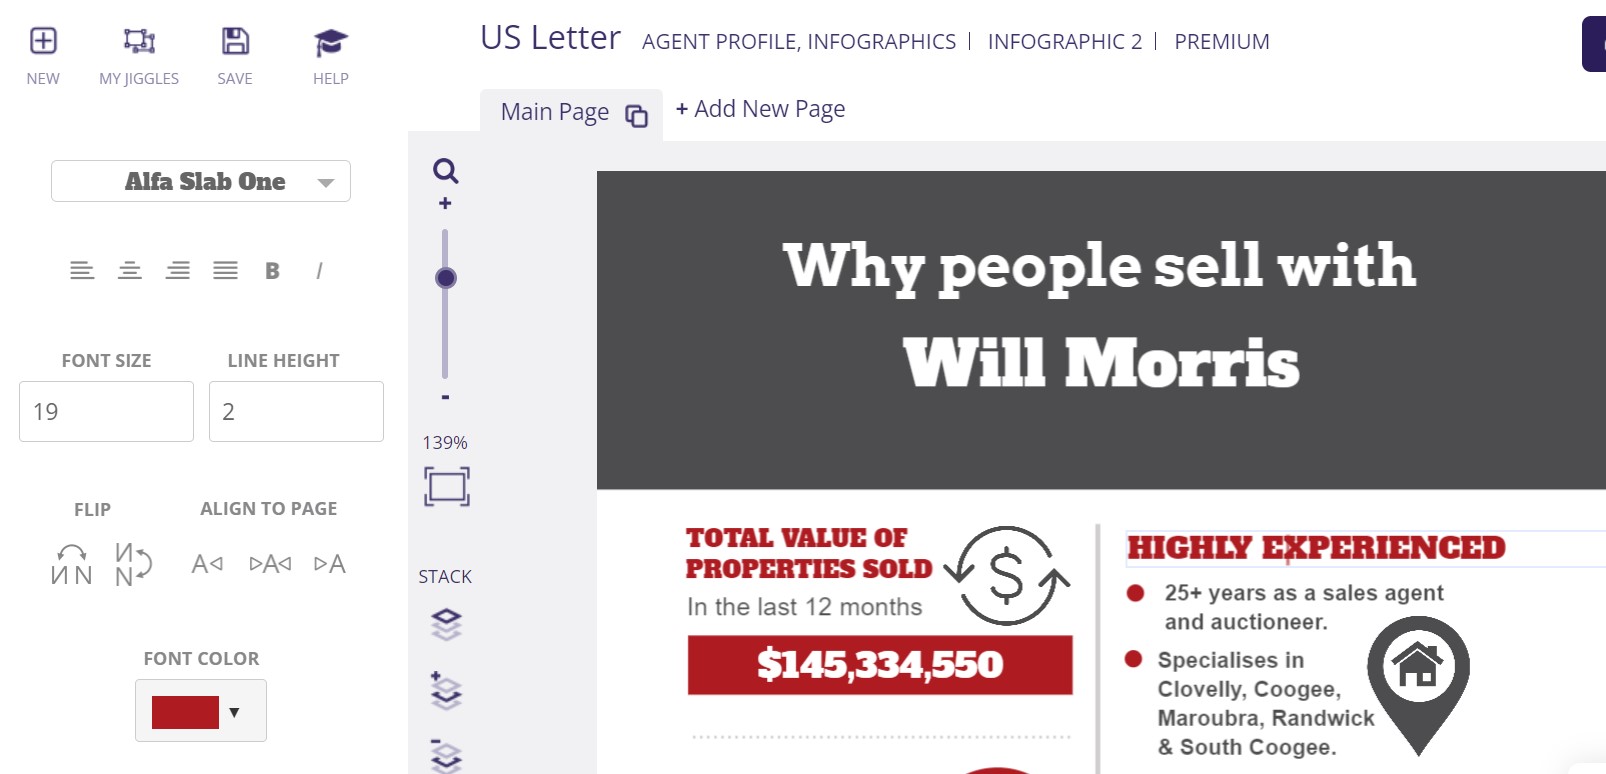
By default, your infographic template should be populated with your account details, such as your name, logo, and email address. You can then edit any element by clicking on it and adjusting its settings in the left panel.
For example, you might edit the text’s content, font, alignment, and color. You’ll want to adjust the text to match the information that corresponds to your agency:
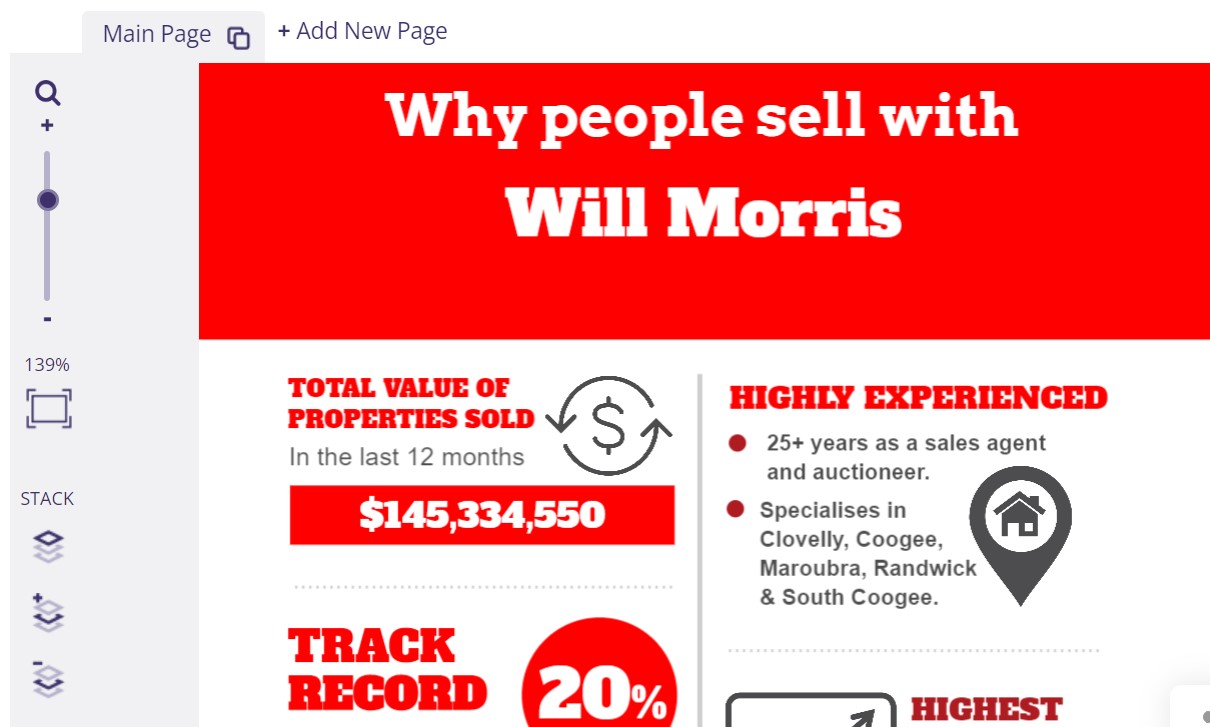
While customizing your infographic, you’ll want to pay attention to color. Using your agency’s colors can reinforce your branding and provoke particular emotions in your clients. Furthermore, choosing bright shades can increase viewers’ attention spans by up to 82%.
For that reason, we’re using a bright red in our infographic to excite potential clients and catch their attention:
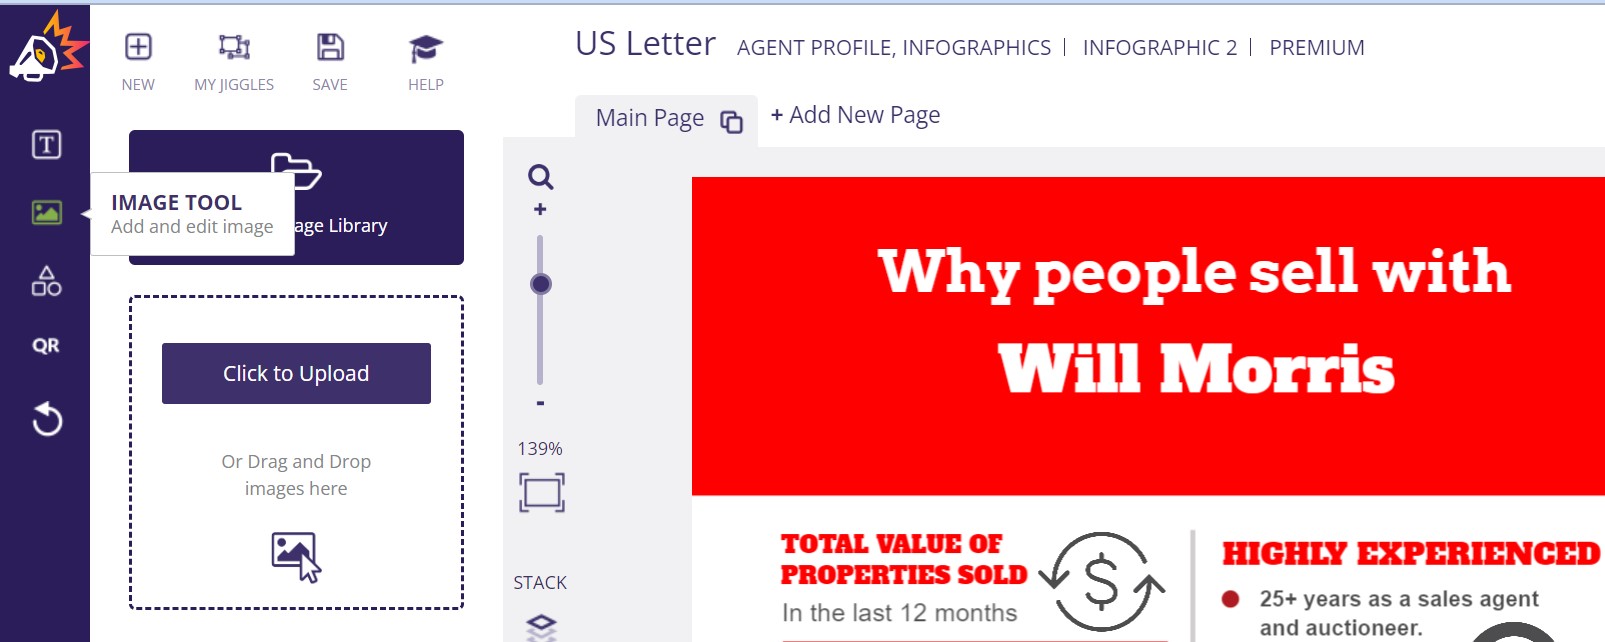
You can add your own images to the infographic by clicking on Image Tool in the far left menu and uploading your files:
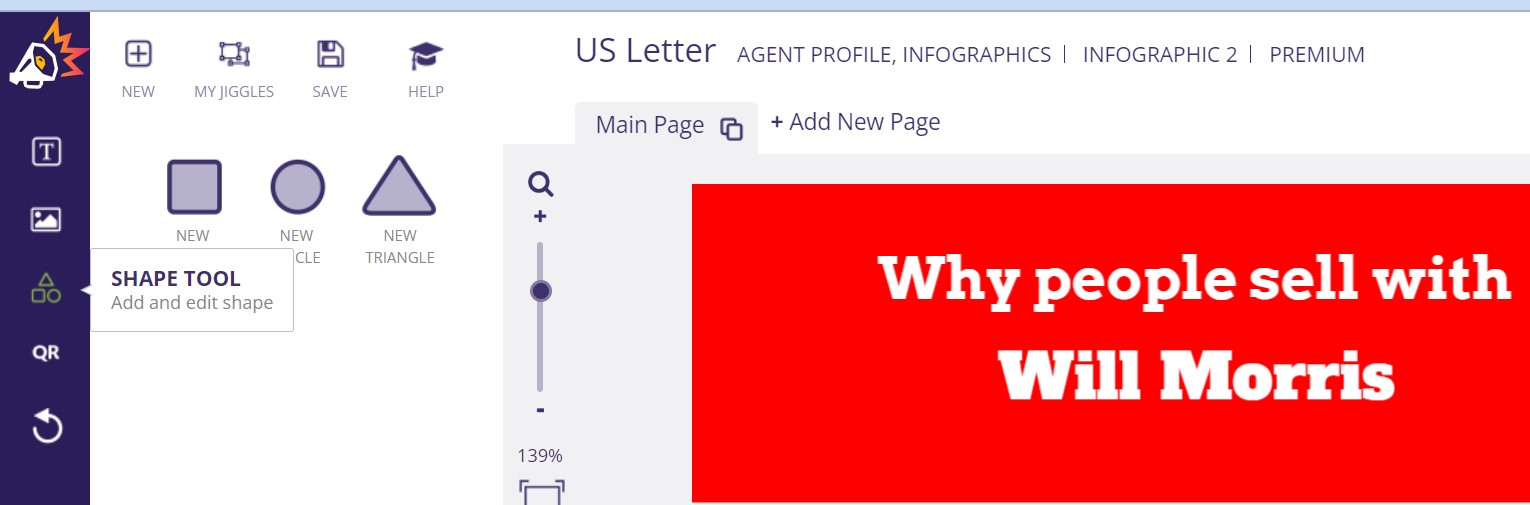
Under Shape Tool, you might add circles, triangles, or rectangles to the infographic:
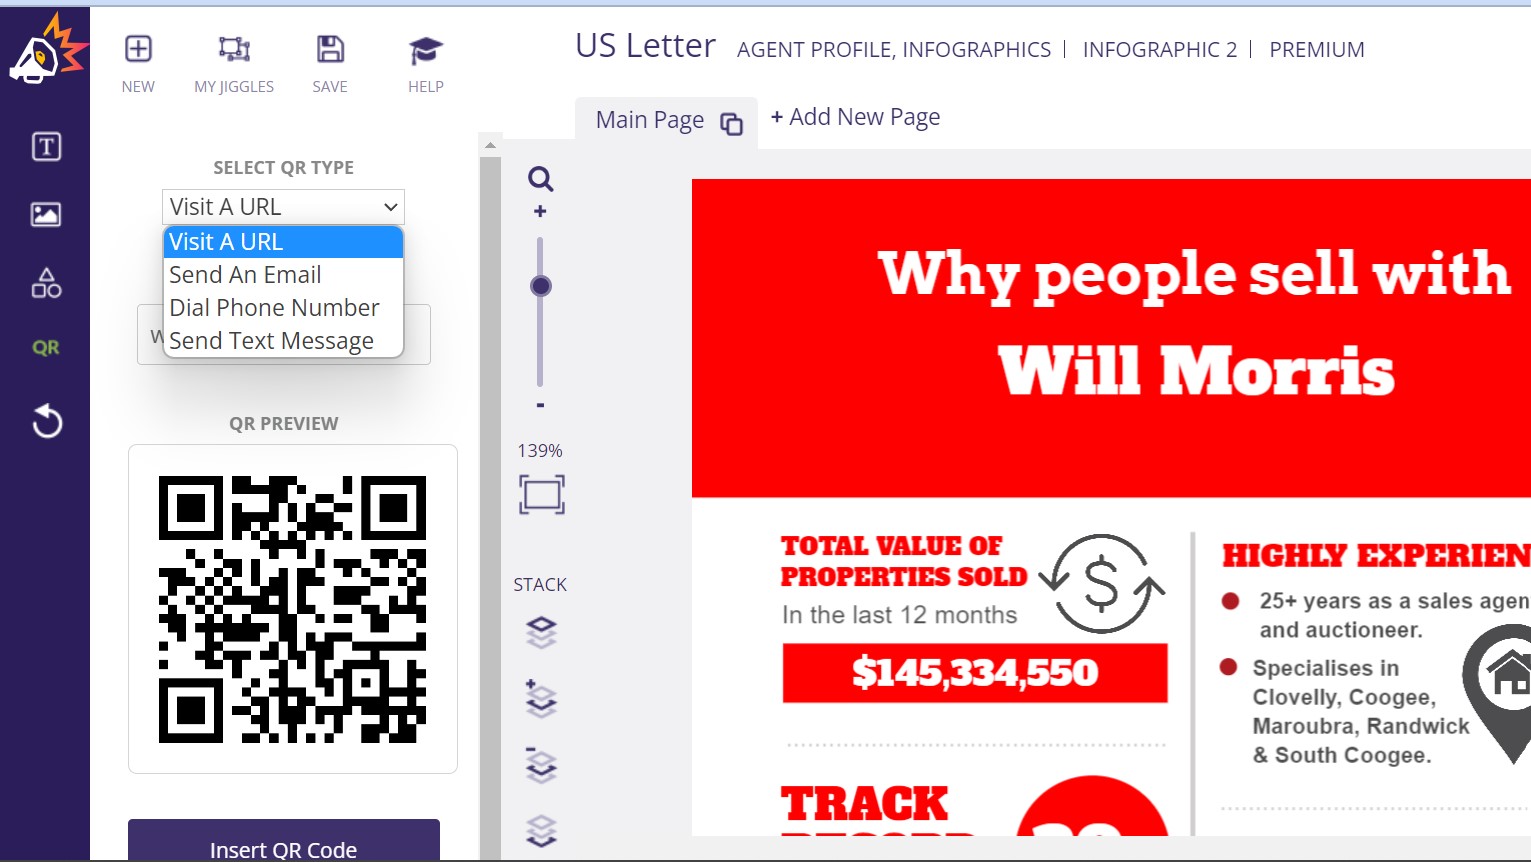
Additionally, under QR, you can create a QR code for your infographic that links to your agency website, sends a text message, calls your company phone, or emails your business. This feature enables clients to contact you quickly:
Play around with your infographic until you’re happy with how it looks. Plus, don’t forget to Save it regularly so that you don’t lose all your hard work.
Step 3: Share Your Real Estate Infographic
When you’re happy with your real estate infographic, it’s time to download or share it. Click on Save in the top menu. Then, you can Download Jiggle to download the file to your computer or Share with Someone to send a link via email:
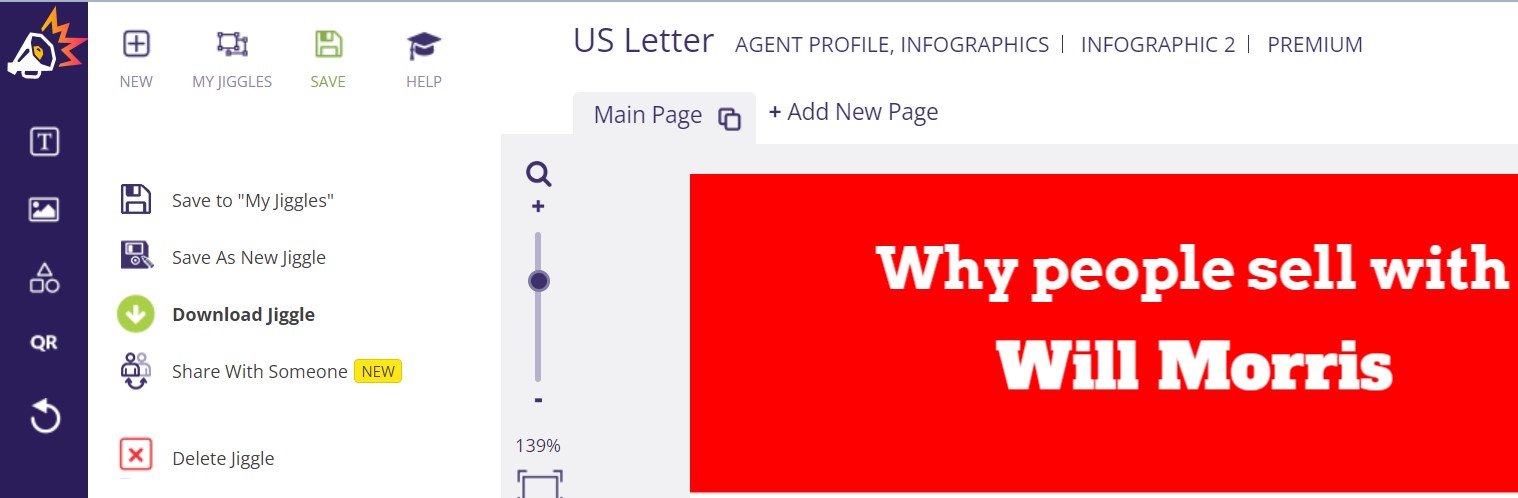
If you click on Download Jiggle, you have the option to download the file as a JPEG, standard PDF, or commercial PDF. If you’re looking to share your infographic online, we recommend choosing JPEG:
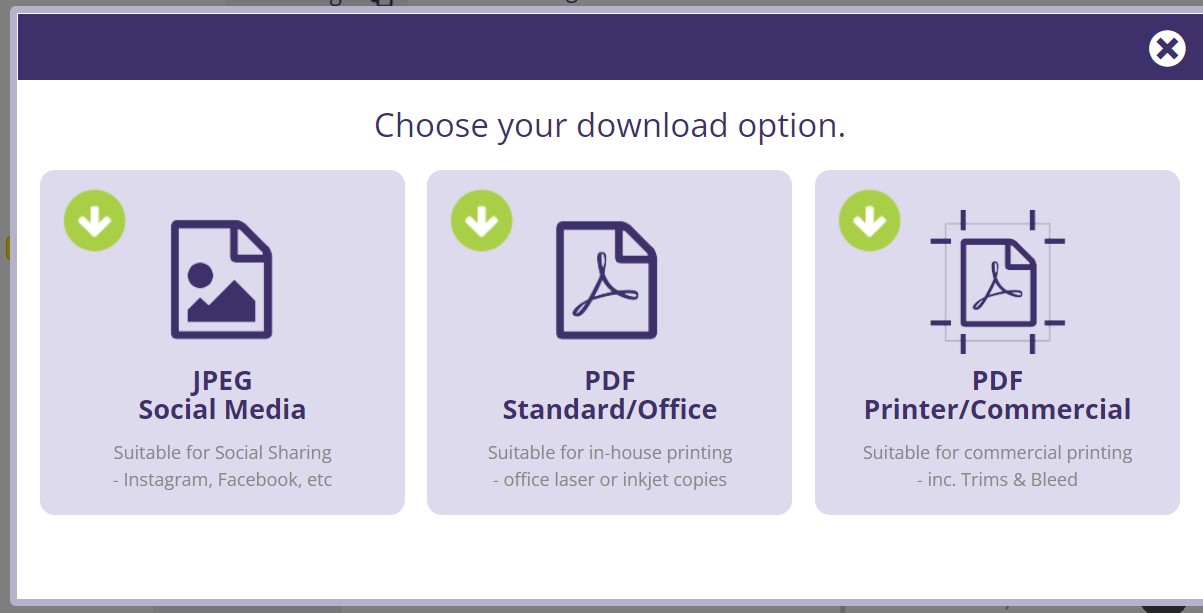
Now you’re free to upload the JPEG to social media sites, your website, or even embed it into emails to your clients. It’s that easy!
Conclusion
With infographics, you can convey complex information about your agency, listings, and buying process in a simple and attractive visual format. Then, you can use this content to attract new clients to your business through social media, your website, and in-person flyers.
To recap, here are three easy steps to create real estate infographics:
- Sign up for Jigglar and choose an infographic template.
- Customize your template.
- Share your real estate infographic.
With Jigglar, you’ll get access to a wide variety of real estate templates, including infographics, social media posts, and flyers. Sign up for a free trial account today to see what you can do with Jigglar!